If you’re looking to Sell Fluke 96 Oscilloscopes : 50 MHz, ScopeMeter
Fluke 96 : Oscilloscopes : 50 MHz, ScopeMeter
Buying, Selling, Trading Fluke 96
If you’re selling your Fluke 96 please fill out form on the right hand side of page.
If you’re looking to Sell Fluke 96 Oscilloscopes : 50 MHz, ScopeMeter
Fluke 96 : Oscilloscopes : 50 MHz, ScopeMeter
Buying, Selling, Trading Fluke 96
If you’re selling your Fluke 96 please fill out form on the right hand side of page.
If you’re looking to Sell Fluke 93 Industrial Scope Meter- 50 MHz
Fluke 93 Industrial Scope Meter- 50 MHz
Buying, Selling, Trading Fluke 93
If you’re selling your Fluke 93 please fill out form on the right hand side of page.
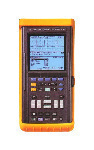
If you’re looking to Sell Fluke 105B 100MHz 2CH 2.5GSa/s Scopemeter
This oscilloscope is a graph displaying device it draws a graph of an electrical signal.
In most applications, the graph shows how signals change over time the vertical (Y) axis represents voltage and the horizontal (X) axis represents time.
The intensity or brightness of the display is sometimes called the Z axis.
Buying, Selling, Trading Fluke 105B
If you’re selling your Fluke 105B please fill out form on the right hand side of page.
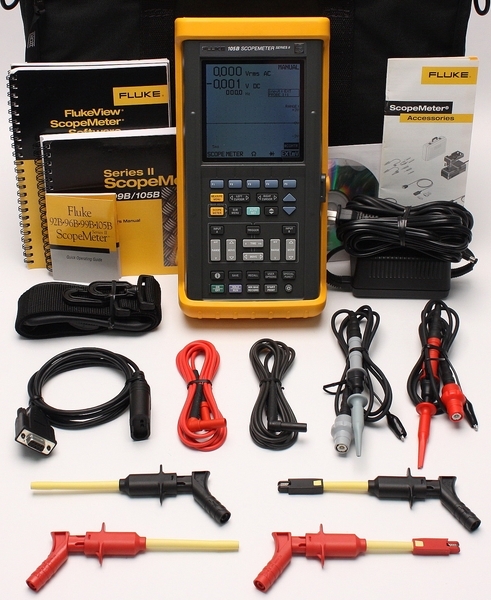
If you’re looking to Sell Fluke 92B ScopeMeter Series II 60MHz Oscilloscope
ScopeMeter Series II is a battery powered combonation scope and meter designed for measurments on-the-go. Just push the MEASURE MENU button, select one of 30 measurments, and ScopeMeter Series II Automaticly configures itself to take the desired reading.
With ScopeMeter Series II, good waveforms are automatic. While probing from test point to test point, the CONTINUOUS AUTOSET feature instantly adjusts the timebase and amplitude. Manual controls are still there, but Series II is so fast and easy, why use anything else!
Designed with a sealed, ruggedized case, the ScopeMeter Series II performs reliably, even in wet, dusty, or dirty enviroments. And the backlit screen makes for easy readings in brights light and no light situations.
Whether it’s an overheating motor, spikeson a circuit, or dimming, flickering lights, the ScopeMeter Series II is ideal for uncovering the source of power quality problems in complex electrical circuits. Series II gives the best accuracy and versatility available in “on-the-go,” battery, powered instruments, and measures automatically.
Highlights:
Buying, Selling, Trading Fluke 92B
Specifications:
SCOPE MODE
Continuous Autoset Hands-free signal probing. Continuously follows input sig-nals from 15 Hz-50 MHz (100 MHz In the Model 105) and automatically selects theproper time base, input range and trigger level.
MIN MAX Envelope Mode Record the waveform excursions with a gray scale envelope on both inputs.
40 ns Glitch Detect Sweep speeds 1 ps/div or slower on Input A
Analog-Like Grey-Scale Display
Waveform Average Smoothing up to 256 waveforms, 10 samples in Roll Mode
Vertical
Zoom Magnifies waveform around the 4th division at the next acquisition (sweep)
Includes:
If you’re selling your Fluke 92B please fill out form on the right hand side of page.
If you’re looking to Sell Fluke 125 40 MHz Industrial ScopeMeter
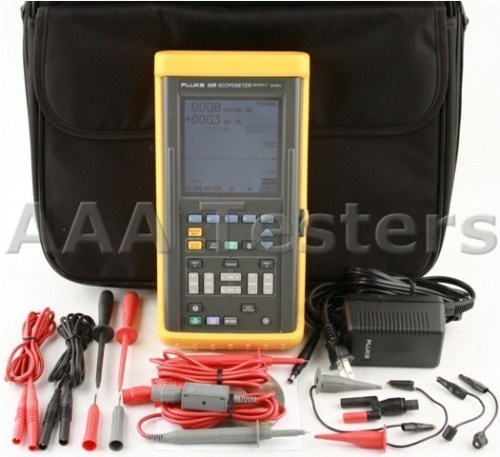
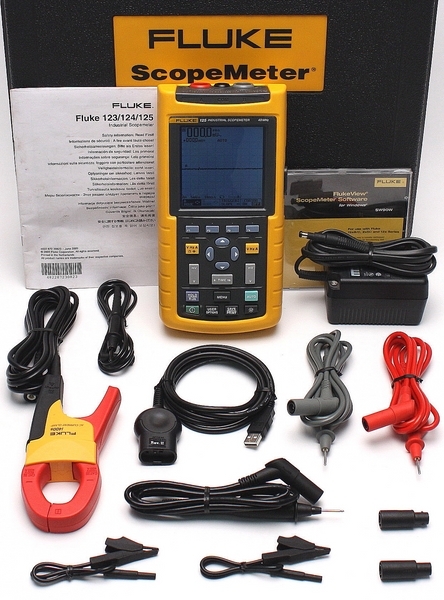
The Fluke 125 Industrial ScopeMeter is a rugged, reliable solution for industrial troubleshooting and installation applications. Integrated test tool, with oscilloscope, multimeter, and “paperless” recorder in one affordable, easy-to-use instrument.
As the latest addition to the Fluke 120 Series ScopeMeters, the Fluke 125 has advanced features for installing and troubleshooting field buses and electrical machines. The ScopeMeter performs a bus health test on industrial buses, for example, which are rapidly becoming a headache for Service, Maintenance and Installation (SMI) engineers. The test quickly determines whether the bus is working and if not, helps to identify the cause. The rugged ScopeMeter works with many Industrial Networks including AS-I bus, CAN-bus, Profibus, Foundation Fieldbus and Ethernet.
In addition, the instrument can test power input, sensor timing, motor windings, drive output timing and power measurements – thus eliminating the need for expensive, more specialized test equipment.
The ScopeMeters are 600 V CAT III safety certified for machinery, instrumentation, control and power systems. The new Fluke 125 has all the features of the successful Fluke 123 and Fluke 124 ScopeMeters and, in addition to the bus health test, it also carries out effective (Vpwm) voltage measurements of motor drive output, and has 0.01 ohm resolution on the 50 Ohms range for testing motor windings. User-named data setups make for easy use. The 125 extends the 120 series by adding; Industrial networks bus health testing and Measure harmonics and power, VA, VAR, W, and PF
Simple good/bad readout for Field Bus parameters
The bus health tests of the Fluke 125 ScopeMeter find defects like bad or missing terminators, bad cable splits, missing links, incorrect line loading, line interrupts, short circuit conditions and reflections. The instrument continuously acquires the bus signal and compares parameters to official specifications. It displays bus speed and measures signal quality with ‘good’ or ‘bad’ indications for parameters like rise- and fall-time, amplitude, bias level, pulse width and distortion. The instrument checks at the hardware (not protocol) level. An eye-pattern mode allows for a visual check of signal integrity.
Harmonic analysis and power consumption
Extended Harmonics Analysis of mains waveforms reaches up to the 33rd harmonic. That includes the important 3rd and 5th harmonics, which may be the cause of overheating in neutral wire or motor, as well as flat-topping of the mains voltage from non-linear loads like SMPS units. The wide frequency range covers railway (16.66 Hz) and airplane systems (400 Hz) applications.
Power measurements cover single-phase and balanced-3-phase, 3-wire systems (Watt, VA, VAR and Power Factor). Unlike PQ analyzers, the instrument is not restricted to 50/60 Hz, and can measure power at the output of motor drives and frequency converters.
The Vpwm measurement capability shows the output voltage of motor drives exactly as the motor perceives it. For electrical and combustion engines, the 125 can indicate revolutions-per-minute (rpm), and can be set up for 1 or 2 rotations per pulse, or 1 rotation per 2 or 4 pulses. A 50-ohm resistance range brings excellent 0.01-ohm resolution for checking motor windings and other wiring.
Series automates measurements from industrial systems
The Fluke ScopeMeter 120 Series performs automated measurements on motor, switch and similar signals. The 123 has a 20 MHz bandwidth, while the 124 is a 40 MHz bandwidth instrument that performs more advanced measurements. The 125 is also a 40 MHz instrument but includes features for testing Field Bus and motors. All incorporate Fluke’s unique Connect-and-View to recognize signal patterns, and automatically set up correct triggering.
Bus Health mode allows for an analysis of the signal quality on industrial network, comparing measured signals to the standards’ signal requirements. Fluke 125 is the ScopeMeter of choice for the maintenance engineer who deals with industrial machinery and the industrial network connecting his machinery the like. The Fluke 125 has all the functionality of the 124 plus it comes with the following extensions:
Buying, Selling, Trading Fluke 125
If you’re selling your Fluke 125 please fill out form on the right hand side of page.
If you’re looking to Sell Fluke 124 Precision Industrial Scopemeter 40MHZ
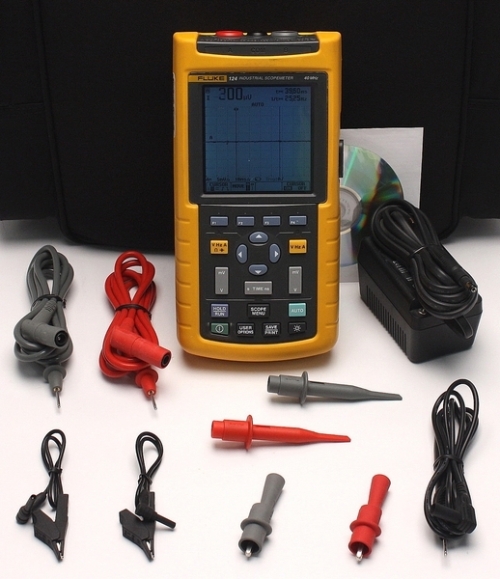
The compact Fluke 124 ScopeMeter Fluke offers the rugged solution for industrial troubleshooting and installation applications. It’s a truly integrated test tool, with oscilloscope, multimeter and “paperless” recorder in one affordable, easy-to-use instrument. Find fast answers to problems in machinery, instrumentation, control and power systems.
Features:
Buying, Selling, Trading Fluke 124
If you’re selling your Fluke 124 please fill out form on the right hand side of page.
If you’re looking to Sell Fluke 225C ScopeMeter Handheld Oscilloscope
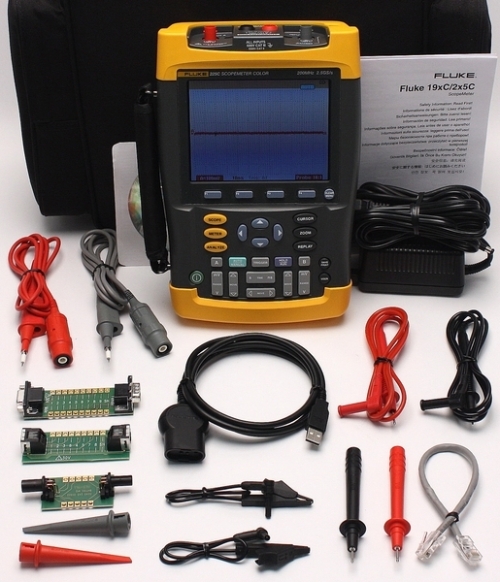
Fluke 225C – Color ScopeMeter with Industrial Bus Health Test capability
Based on the 199C and 196C Color ScopeMeters, the 225C offers the full functionality of those instruments yet with the addition of powerful test capabilities for a wide variety of Industrial Bus systems. When in Bus health Test mode, these ScopeMeters automatically make an analysis of the electrical signals passing through the bus, and compare the parameters to standard values as described in the industry standards for that bus type. Alternatively, the user may select an ‘Eyepattern’ display to visually check the overall signal quality.
Parameters are automatically qualified as ‘good’, ‘weak’ or ‘bad’ based on a comparison to the appropriate industrial standards or to user set reference values. Each of the measured parameters is presented with momentary value and with statistical minimum and maximum values measured over time. The reference values used are also displayed, to give the user an easier grip on the systems behaviour. Tested parameters include signal amplitudes, bias voltage, rise- and fall-times, jitter, distortion and noise levels (in-band noise as well as out-of-band noise) depending on the requirements of the associated industry standard.
Features
The Fluke 225C and 215C are the instruments of choice for maintenance specialists who deal with industrial buses and networks as well as with general electronics. You can verify the electrical integrity of your bus and network, performing ‘physical layer tests’ and getting answers quickly and easily.
Based on the 200 MHz or 100 MHz 190C Series Color ScopeMeters, these instruments offer all functions found in the 190C Series, with Bus Health Test capabilities added on top.
Bus Health Test
Bus Health Test analyses the electrical signals on the industrial bus or network and gives a clear “Good, “Weak or “Bad validation mark for each of the relevant parameters, presented next to the actual measurement value. Measured values are compared to standard values based on the selected bus type, or you may set your personal reference values if you need different tolerances.
Buying, Selling, Trading Fluke 225C

Automatic analysis and validation of electrical signal parameters
All common bus types are supported
The 225C and 215C ScopeMeters support not just one or two bus systems but all commonly seen industrial buses. From the lower speed AS-i and CAN to the higher speed Ethernet 100Base-T based systems are covered by a single instrument. A simple menu structure allows for selecting the main bus type and, where applicable, sub-types listed in a sub-menu for easy selection. Tested parameters and reference values are then set according the selection made.

All common bus types are supported and accessible through a simple menu structure
Large color screen
The large color screen of the 225C and 215C shows the individual parameters with validation, the actual measured value, the minimum and maximum values recorded over time, and the reference values used for the validation. The choice of parameters differs with the bus type and may include bias voltage, signal high- and low-levels, rise- and fall-times, in-band and out-of-band noise levels, jitter, pulse width, baudrate, and more. The activity indicators tell you the data ?ow is ongoing and they stop ?ashing the moment communications come to a halt.
Making test connections
The large screen also gives wiring information for each of the supported bus types, giving the user guidance in making the test connections. A set of break-out adapters is included with the 225C and 215C to give access to each of the wires and pins of the commonly used connection systems M12, DB-9 and RJ-45.

On screen ‘help’ information includes visual guidance on making the test connections. The independently isolated input channels of the 225C support truly differential measurements on bus systems.

BHT190 Break-out adapter with DB-9 connectors gives access to all individual wires and pins of the connection system.
Eyepattern Mode
The Fluke 225C and 215C can make the signal quality validation as soon as electrical signals are passed along the network, without looking at the data content. They ?nd errors like improper cable connections, bad contacts, incorrect grounding and missing or super?uous terminators. In the eye-pattern mode, a waveform display is built over successive signal passes to give you a visual indication of overall signal quality, noise levels and signal jitter, using the scope’s user selectable persistence mode.

Eyepattern mode allows for a visual check of signal quality
Floating independently isolated input channels
Thanks to the independently isolated input channels and the ?oating inputs, the ScopeMeter can take truly ?oating differential measurements from balanced 2-wire systems such as RS-485 and CAN, giving a high level of suppression for common mode disturbances and noise. One input channel can be connected to measure the voltage between the two signal wires, and the other can be connected to measure the common mode voltage over ground at the same time, independently. This way, you may also measure the signals passing through the twisted wires of the 100Base-T Ethernet.

Isolated, floating channels give a high immunity to common mode noise and allow for direct measurements on balanced, two-wire systems including Ethernet 100Base-T.
Fluke 225C compared with other ScopeMeters
All ScopeMeters allow you to perform the basic electrical tests (such as copper resistance and isolation tests) on an electrical system or a cable. The Fluke 125 offers a cost-effective solution for making tests on industrial buses and networks, using a common reference (‘ground’) connection. The Fluke 125 also includes a fully featured 40 MHz Industrial ScopeMeter. The 225C gives more extensive industrial bus signal analysis capabilities. Thanks to the isolated channel structure, the 225C gives a far better immunity to common mode noise and disturbances and can measure common mode voltages separately. On top, the 225C comes with higher measurement speeds and gives you all the measurement capabilities associated with the 190C Series.
If you’re selling your Fluke 225C please fill out form on the right hand side of page.
If you’re looking to Sell Fluke 199CM Medical Color ScopeMeter 200 MHz 199C
ScopeMeter® 190M Series : All this power in your hand!
The ScopeMeter 190M Series are high-performance oscilloscopes in a rugged, handheld and battery powered package, offering specifications typically found on top-end bench instruments only:
See what’s really happening
 |
| High sampling rate gives you the required resolution for detailed signal analysis |
With a maximum real-time sampling rate of 2.5 GS/s per input, you can see what really happens, with 400 ps resolution. Both inputs have their own digitizer, so you can simultaneously acquire two waveforms and analyze them with the highest resolution and detail. If an anomaly flashes by on the screen, just press the Replay button to see it again. And thanks to the wider screen, you will always see a 12 divisions time-window – giving a far better overview of what’s happening both before and after the trigger event!
Deeper waveform acquisition memory (NEW)
 |
| Thanks to the deeper memory, very small parts of the waveform can be studied in full detail using ‘zoom’. |
The waveform memory of all oscilloscopes in both the 190B and 190C Series has been enlarged to allow as many as 3000 samples per channel to be acquired. This is 1800 samples more than before, giving much greater waveform resolution. You can use the ZOOM function to find tiny details in a long waveform, for example, the color burst in a video signal or a single impulse in a complex data-stream. All models also allow the high-resolution waveforms to be transferred to a PC for later detailed analysis using FlukeView ScopeMeter software.
Easier identification of traces, everywhere
 |
| Color traces and the high contrast display make signal identification easy |
The full-color display makes identification of individual waveforms easier, particularly when displaying large amplitude or multiple overlapping waveforms on screen. On-screen color labels, measurements and warnings are clearly linked to specific waveforms. The bright, high contrast display allows for clear reading under varying light conditions. And still a 4 hour battery operation time is assured!
See dynamic signal behavior instantaneously
 |
| Digital persistence mode gives analog scope like display of complex and modulated signals |
The Digital Persistence uses multiple intensity levels and user selectable decay time -it’s as if you’re looking at the display of an analog, real time oscilloscope! The fast display update rate that’s a standard on all models reveals signal changes instantaneously, useful for instance when making adjustments to a system under test.
Advanced trigger modes
 |
| Pulse width triggering allows you to find anomalies like missing pulses |
A wide choice of automatic and manual trigger modes gives you the flexibility to capture just about any signal you’ll encounter. Connect-and-View™ triggering is ideal for fast and easy checking of multiple test-points. The manual modes include time delay, video and pulse-width triggering. A fully isolated external trigger input is included for troubleshooting time relationships between two input signals synchronized to a third signal.
(NEW)
 |
| Dual-slope triggering used to capture the eyepattern on a digital datastream. |
Two new modes – ‘n-cycle triggering’ and ‘dual-slope triggering’ – have been added to the Fluke 190C Series to help you isolate the phenomena of interest. N-cycle triggering ensures you get a stable ‘live’ image of a signal, for example, in frequency dividers and clocked (synchronous) digital systems, or to synchronize on bursts of pulses. Dual-slope triggering enables the oscilloscopes to trigger on both rising and falling edges alike.
This means that any edge in the signal will act as trigger event and initiate a new waveform acquisition, a most useful capability when making eye-patterns from digital data-streams, or in conjunction with single-shot phenomena.
Automatic capture and replay of 100 screens
 |
Scope users know how frustrating it is to see a one-time anomaly flash by, never to be seen again. Not with the ScopeMeter 190 Series! Now you can look back in time with a touch of the replay button. In normal use, the instrument continuously memorizes the last 100 screens. Each time a new screen is acquired, the oldest is discarded. At any moment you can “freeze” the last 100 screens and scroll through picture-by-picture or replay as a ‘live’ animation. Cursors can be used for further analysis. Or you can use the advanced trigger capabilities to capture up to 100 specific events. Two sets of 100 captured screens with individual time stamps can be stored for later recall or download to a PC.
Deep memory for high-resolution ScopeRecord™
 |
| Use the 27,500 points memory of the ScopeRecord mode and zoom in for maximum detail |
The ScopeRecord memory stores 27,500 points per input or more, for high resolution recording of events up to 48 hours, and captures fast intermit-tents and glitches as short as 50 ns. This continuous roll mode stores, for example, events like motion profiles, UPS-, power supply- and motor start-ups. All models also have a ‘Stop-on-Trigger’ in the ScopeRecord mode. This allows the ScopeMeter to store waveform data until the instrument is triggered or until a repetitive trigger signal is interrupted. This way, the instrument will, for example, automatically recognize a power failure and store the waveform data preceding it. And with 100 x zoom, you can look at the smallest details, like individual power cycles. Two of these 27,500 point recordings can be stored for later analysis.
Measure from mV to kV – fully isolated and safely!
 |
| Use Vpwm and measure effective voltage on motor drive and frequency inverter outputs |
The ScopeMeter 190 Series have three independently floating isolated inputs. While conventional oscilloscopes can only make measurements referenced to the line power ground, measurements on each of the Fluke ScopeMeter 190 Series inputs can be referenced to a different “low” level. This enables measurements in mixed circuits having different ground references, and also eliminates the risk of accidental ground short circuits. All inputs are safety certified for measurements in 1000 V CAT II and 600 V CAT III environments. And the standard probes cover a wide application range from mV to kV, making the ScopeMeter 190 Series ideal for micro-electronics to electrical power applications.
Buying, Selling, Trading Fluke 199CM
Analysis power
 |
| A wide variety of measurements can be made on either Channel A or B |
For analysis of waveforms, ScopeRecord and TrendPlot recordings, the ScopeMeter 190 Series feature 30 automatic measurements, plus cursors, zoom and a real-time clock. The analysis can be made directly or later when back in the office. Up to 2 recordings and 10 scope screens can be stored for analysis, print-out or download to a PC.
Frequency Spectrum Analysis (NEW)
 |
| Frequency Spectrum shows an overview of frequencies contained in a signal. |
All 190C Color ScopeMeters now include Frequency Spectrum Analysis functionality based on Fast Fourier Transformation (FFT) analysis as a standard feature. This makes it possible for you to identify the individual frequency components contained in a signal. The spectrum analysis function is also handy to reveal the effects of vibration, signal interference or crosstalk. An automatic window function assures optimal windowing, although you may manually select your preferred time window.
Waveform Pass / Fail Testing
 |
| Pass/Fail testing of actual signal against a reference template |
‘Waveform reference’ allows an acquired trace to be stored and designated ‘reference trace’ for visual comparisons, or it can be used as the reference for automatic ‘Pass / Fail’ testing (190C). Up to 100 individually matching (‘Pass’) or non-matching (‘Fail’) waveforms can be stored in the replay memory, allowing you to monitor your system’s behavior over a long period of time, without the need for you to attend!
Cursor-limited automatic measurement (NEW)
 |
| The rms-value of the noise is measured on the part of the waveform enclosed by the cursors. |
Automatic power and Vrms-measurements can now be performed on a specific, user identified portion of the waveform using the cursors of the Fluke 190C to define the time-window of interest. In this way, the Color ScopeMeter can measure the power within a specified time span, or the rms-value of a voltage during a dedicated period of time.
… and there is more
|
Use TrendPlot™ to help find intermittents, fast
 |
| Cursors and zoom help you analyze the captured TrendPlot |
The toughest faults to find are those that happen only once in a while: intermittents. They can be caused by bad connections, dust, dirt, corrosion or simply broken wiring or connectors. You may not be around to see it – your Fluke ScopeMeter will. In this “paperless recorder” mode, you can plot the minimum and maximum peak values and average over time – up to 22 days. The two inputs can plot any combination of voltage, current, temperature, frequency and phase – with time and date stamp -to help lead you to the cause of those faults quickly.
FlukeView® Software for documenting, archiving and analysis
FlukeView® for Windows® helps you get more out of your ScopeMeter by:
If you’re selling your Fluke 199CM please fill out form on the right hand side of page.
If you’re looking to Sell Fluke 199C ScopeMeter 200 MHz Color Oscilloscope
ScopeMeter® 190 Series : All this power in your hand!
The ScopeMeter 190 Series has specifications you typically only find on high-end bench oscilloscopes. They offer up to 200 MHz bandwidth for capturing high frequency signals, as found in today’s state-of-the-art electronics, 2.5 GS/s real-time sampling and advanced memory and triggering functions. They’re rugged, compact and battery powered.
General Features:
See what’s really happening
|
| High sampling rate gives you the required resolution for detailed signal analysis |
With a maximum real-time sampling rate of 2.5 GS/s per input, you can see what really happens, with 400 ps resolution. Both inputs have their own digitizer, so you can simultaneously acquire two waveforms and analyze them with the highest resolution and detail. If an anomaly flashes by on the screen, just press the Replay button to see it again. And thanks to the wider screen, you will always see a 12 divisions time-window – giving a far better overview of what’s happening both before and after the trigger event!
Deeper waveform acquisition memory (NEW)
|
| Thanks to the deeper memory, very small parts of the waveform can be studied in full detail using ‘zoom’. |
The waveform memory of all oscilloscopes in both the 190B and 190C Series has been enlarged to allow as many as 3000 samples per channel to be acquired. This is 1800 samples more than before, giving much greater waveform resolution. You can use the ZOOM function to find tiny details in a long waveform, for example, the color burst in a video signal or a single impulse in a complex data-stream. All models also allow the high-resolution waveforms to be transferred to a PC for later detailed analysis using FlukeView ScopeMeter software.
Easier identification of traces, everywhere
|
| Color traces and the high contrast display make signal identification easy |
The full-color display makes identification of individual waveforms easier, particularly when displaying large amplitude or multiple overlapping waveforms on screen. On-screen color labels, measurements and warnings are clearly linked to specific waveforms. The bright, high contrast display allows for clear reading under varying light conditions. And still a 4 hour battery operation time is assured!
See dynamic signal behavior instantaneously
|
| Digital persistence mode gives analog scope like display of complex and modulated signals |
The Digital Persistence uses multiple intensity levels and user selectable decay time -it’s as if you’re looking at the display of an analog, real time oscilloscope! The fast display update rate that’s a standard on all models reveals signal changes instantaneously, useful for instance when making adjustments to a system under test.
Advanced trigger modes
|
| Pulse width triggering allows you to find anomalies like missing pulses |
A wide choice of automatic and manual trigger modes gives you the flexibility to capture just about any signal you’ll encounter. Connect-and-View™ triggering is ideal for fast and easy checking of multiple test-points. The manual modes include time delay, video and pulse-width triggering. A fully isolated external trigger input is included for troubleshooting time relationships between two input signals synchronized to a third signal.
(NEW)
|
| Dual-slope triggering used to capture the eyepattern on a digital datastream. |
Two new modes – ‘n-cycle triggering’ and ‘dual-slope triggering’ – have been added to the Fluke 190C Series to help you isolate the phenomena of interest. N-cycle triggering ensures you get a stable ‘live’ image of a signal, for example, in frequency dividers and clocked (synchronous) digital systems, or to synchronize on bursts of pulses. Dual-slope triggering enables the oscilloscopes to trigger on both rising and falling edges alike. This means that any edge in the signal will act as trigger event and initiate a new waveform acquisition, a most useful capability when making eye-patterns from digital data-streams, or in conjunction with single-shot phenomena.
Automatic capture and replay of 100 screens
|
Scope users know how frustrating it is to see a one-time anomaly flash by, never to be seen again. Not with the ScopeMeter 190 Series! Now you can look back in time with a touch of the replay button. In normal use, the instrument continuously memorizes the last 100 screens. Each time a new screen is acquired, the oldest is discarded. At any moment you can “freeze” the last 100 screens and scroll through picture-by-picture or replay as a ‘live’ animation. Cursors can be used for further analysis. Or you can use the advanced trigger capabilities to capture up to 100 specific events. Two sets of 100 captured screens with individual time stamps can be stored for later recall or download to a PC.
Deep memory for high-resolution ScopeRecord™
|
| Use the 27,500 points memory of the ScopeRecord mode and zoom in for maximum detail |
The ScopeRecord memory stores 27,500 points per input or more, for high resolution recording of events up to 48 hours, and captures fast intermit-tents and glitches as short as 50 ns. This continuous roll mode stores, for example, events like motion profiles, UPS-, power supply- and motor start-ups. All models also have a ‘Stop-on-Trigger’ in the ScopeRecord mode. This allows the ScopeMeter to store waveform data until the instrument is triggered or until a repetitive trigger signal is interrupted. This way, the instrument will, for example, automatically recognize a power failure and store the waveform data preceding it. And with 100 x zoom, you can look at the smallest details, like individual power cycles. Two of these 27,500 point recordings can be stored for later analysis.
Buying, Selling, Trading Fluke 199C
Measure from mV to kV – fully isolated and safely!
|
| Use Vpwm and measure effective voltage on motor drive and frequency inverter outputs |
The ScopeMeter 190 Series have three independently floating isolated inputs. While conventional oscilloscopes can only make measurements referenced to the line power ground, measurements on each of the Fluke ScopeMeter 190 Series inputs can be referenced to a different “low” level. This enables measurements in mixed circuits having different ground references, and also eliminates the risk of accidental ground short circuits. All inputs are safety certified for measurements in 1000 V CAT II and 600 V CAT III environments. And the standard probes cover a wide application range from mV to kV, making the ScopeMeter 190 Series ideal for micro-electronics to electrical power applications.
Analysis power
|
| A wide variety of measurements can be made on either Channel A or B |
For analysis of waveforms, ScopeRecord and TrendPlot recordings, the ScopeMeter 190 Series feature 30 automatic measurements, plus cursors, zoom and a real-time clock. The analysis can be made directly or later when back in the office. Up to 2 recordings and 10 scope screens can be stored for analysis, print-out or download to a PC.
Frequency Spectrum Analysis (NEW)
|
| Frequency Spectrum shows an overview of frequencies contained in a signal. |
All 190C Color ScopeMeters now include Frequency Spectrum Analysis functionality based on Fast Fourier Transformation (FFT) analysis as a standard feature. This makes it possible for you to identify the individual frequency components contained in a signal. The spectrum analysis function is also handy to reveal the effects of vibration, signal interference or crosstalk. An automatic window function assures optimal windowing, although you may manually select your preferred time window.
Waveform Pass / Fail Testing
|
| Pass/Fail testing of actual signal against a reference template |
‘Waveform reference’ allows an acquired trace to be stored and designated ‘reference trace’ for visual comparisons, or it can be used as the reference for automatic ‘Pass / Fail’ testing (190C). Up to 100 individually matching (‘Pass’) or non-matching (‘Fail’) waveforms can be stored in the replay memory, allowing you to monitor your system’s behavior over a long period of time, without the need for you to attend!
Cursor-limited automatic measurement (NEW)
|
| The rms-value of the noise is measured on the part of the waveform enclosed by the cursors. |
Automatic power and Vrms-measurements can now be performed on a specific, user identified portion of the waveform using the cursors of the Fluke 190C to define the time-window of interest. In this way, the Color ScopeMeter can measure the power within a specified time span, or the rms-value of a voltage during a dedicated period of time.
… and there is more
|
Use TrendPlot™ to help find intermittents, fast
|
| Cursors and zoom help you analyze the captured TrendPlot |
The toughest faults to find are those that happen only once in a while: intermittents. They can be caused by bad connections, dust, dirt, corrosion or simply broken wiring or connectors. You may not be around to see it – your Fluke ScopeMeter will. In this “paperless recorder” mode, you can plot the minimum and maximum peak values and average over time – up to 22 days. The two inputs can plot any combination of voltage, current, temperature, frequency and phase – with time and date stamp -to help lead you to the cause of those faults quickly.
FlukeView® Software for documenting, archiving and analysis FlukeView® for Windows® helps you get more out of your ScopeMeter by:
If you’re selling your Fluke 199C please fill out form on the right hand side of page.
If you’re looking to Sell Fluke 199BM Medical ScopeMeter Oscilloscope
ScopeMeter® 190 Series : All this power in your hand!
The Fluke 190 Series Medical ScopeMeters are high-performance oscilloscopes for the most demanding applications when servicing medical imaging equipment and video systems. Based upon the Fluke 190B / 190C Series ScopeMeters, the Fluke Medical ScopeMeter offers measurement capabilities optimized for servicing medical equipment in the following modalities: X-ray, MRI, Nuclear Medicine and Ultrasound.
The /M Medical version is a standard Fluke 190B/C Series ScopeMeter test tool with the following additional functionality:
The ScopeMeter 190 Series has specifications you typically only find on high-end bench oscilloscopes. They offer up to 200 MHz bandwidth for capturing high frequency signals, as found in today’s state-of-the-art electronics, 2.5 GS/s real-time sampling and advanced memory and triggering functions. They’re rugged, compact and battery powered.
General Features:
See what’s really happening
|
| High sampling rate gives you the required resolution for detailed signal analysis |
With a maximum real-time sampling rate of 2.5 GS/s per input, you can see what really happens, with 400 ps resolution. Both inputs have their own digitizer, so you can simultaneously acquire two waveforms and analyze them with the highest resolution and detail. If an anomaly flashes by on the screen, just press the Replay button to see it again. And thanks to the wider screen, you will always see a 12 divisions time-window – giving a far better overview of what’s happening both before and after the trigger event!
Deeper waveform acquisition memory (NEW)
|
| Thanks to the deeper memory, very small parts of the waveform can be studied in full detail using ‘zoom’. |
The waveform memory of all oscilloscopes in both the 190B and 190C Series has been enlarged to allow as many as 3000 samples per channel to be acquired. This is 1800 samples more than before, giving much greater waveform resolution. You can use the ZOOM function to find tiny details in a long waveform, for example, the color burst in a video signal or a single impulse in a complex data-stream. All models also allow the high-resolution waveforms to be transferred to a PC for later detailed analysis using FlukeView ScopeMeter software.
Easier identification of traces, everywhere
|
| Color traces and the high contrast display make signal identification easy |
The full-color display makes identification of individual waveforms easier, particularly when displaying large amplitude or multiple overlapping waveforms on screen. On-screen color labels, measurements and warnings are clearly linked to specific waveforms. The bright, high contrast display allows for clear reading under varying light conditions. And still a 4 hour battery operation time is assured!
See dynamic signal behavior instantaneously
|
| Digital persistence mode gives analog scope like display of complex and modulated signals |
The Digital Persistence uses multiple intensity levels and user selectable decay time -it’s as if you’re looking at the display of an analog, real time oscilloscope! The fast display update rate that’s a standard on all models reveals signal changes instantaneously, useful for instance when making adjustments to a system under test.
Advanced trigger modes
|
| Pulse width triggering allows you to find anomalies like missing pulses |
A wide choice of automatic and manual trigger modes gives you the flexibility to capture just about any signal you’ll encounter. Connect-and-View™ triggering is ideal for fast and easy checking of multiple test-points. The manual modes include time delay, video and pulse-width triggering. A fully isolated external trigger input is included for troubleshooting time relationships between two input signals synchronized to a third signal.
(NEW)
|
| Dual-slope triggering used to capture the eyepattern on a digital datastream. |
Two new modes – ‘n-cycle triggering’ and ‘dual-slope triggering’ – have been added to the Fluke 190C Series to help you isolate the phenomena of interest. N-cycle triggering ensures you get a stable ‘live’ image of a signal, for example, in frequency dividers and clocked (synchronous) digital systems, or to synchronize on bursts of pulses. Dual-slope triggering enables the oscilloscopes to trigger on both rising and falling edges alike.
This means that any edge in the signal will act as trigger event and initiate a new waveform acquisition, a most useful capability when making eye-patterns from digital data-streams, or in conjunction with single-shot phenomena.
Automatic capture and replay of 100 screens
|
Scope users know how frustrating it is to see a one-time anomaly flash by, never to be seen again. Not with the ScopeMeter 190 Series! Now you can look back in time with a touch of the replay button. In normal use, the instrument continuously memorizes the last 100 screens. Each time a new screen is acquired, the oldest is discarded. At any moment you can “freeze” the last 100 screens and scroll through picture-by-picture or replay as a ‘live’ animation. Cursors can be used for further analysis. Or you can use the advanced trigger capabilities to capture up to 100 specific events. Two sets of 100 captured screens with individual time stamps can be stored for later recall or download to a PC.
Deep memory for high-resolution ScopeRecord™
|
| Use the 27,500 points memory of the ScopeRecord mode and zoom in for maximum detail |
The ScopeRecord memory stores 27,500 points per input or more, for high resolution recording of events up to 48 hours, and captures fast intermit-tents and glitches as short as 50 ns. This continuous roll mode stores, for example, events like motion profiles, UPS-, power supply- and motor start-ups. All models also have a ‘Stop-on-Trigger’ in the ScopeRecord mode. This allows the ScopeMeter to store waveform data until the instrument is triggered or until a repetitive trigger signal is interrupted. This way, the instrument will, for example, automatically recognize a power failure and store the waveform data preceding it. And with 100 x zoom, you can look at the smallest details, like individual power cycles. Two of these 27,500 point recordings can be stored for later analysis.
Measure from mV to kV – fully isolated and safely!
|
| Use Vpwm and measure effective voltage on motor drive and frequency inverter outputs |
The ScopeMeter 190 Series have three independently floating isolated inputs. While conventional oscilloscopes can only make measurements referenced to the line power ground, measurements on each of the Fluke ScopeMeter 190 Series inputs can be referenced to a different “low” level. This enables measurements in mixed circuits having different ground references, and also eliminates the risk of accidental ground short circuits. All inputs are safety certified for measurements in 1000 V CAT II and 600 V CAT III environments. And the standard probes cover a wide application range from mV to kV, making the ScopeMeter 190 Series ideal for micro-electronics to electrical power applications.
Analysis power
|
| A wide variety of measurements can be made on either Channel A or B |
For analysis of waveforms, ScopeRecord and TrendPlot recordings, the ScopeMeter 190 Series feature 30 automatic measurements, plus cursors, zoom and a real-time clock. The analysis can be made directly or later when back in the office. Up to 2 recordings and 10 scope screens can be stored for analysis, print-out or download to a PC.
Frequency Spectrum Analysis (NEW)
|
| Frequency Spectrum shows an overview of frequencies contained in a signal. |
All 190C Color ScopeMeters now include Frequency Spectrum Analysis functionality based on Fast Fourier Transformation (FFT) analysis as a standard feature. This makes it possible for you to identify the individual frequency components contained in a signal. The spectrum analysis function is also handy to reveal the effects of vibration, signal interference or crosstalk. An automatic window function assures optimal windowing, although you may manually select your preferred time window.
Waveform Pass / Fail Testing
|
| Pass/Fail testing of actual signal against a reference template |
‘Waveform reference’ allows an acquired trace to be stored and designated ‘reference trace’ for visual comparisons, or it can be used as the reference for automatic ‘Pass / Fail’ testing (190C). Up to 100 individually matching (‘Pass’) or non-matching (‘Fail’) waveforms can be stored in the replay memory, allowing you to monitor your system’s behavior over a long period of time, without the need for you to attend!
Cursor-limited automatic measurement (NEW)
|
| The rms-value of the noise is measured on the part of the waveform enclosed by the cursors. |
Automatic power and Vrms-measurements can now be performed on a specific, user identified portion of the waveform using the cursors of the Fluke 190C to define the time-window of interest. In this way, the Color ScopeMeter can measure the power within a specified time span, or the rms-value of a voltage during a dedicated period of time.
… and there is more
|
Use TrendPlot™ to help find intermittents, fast
|
| Cursors and zoom help you analyze the captured TrendPlot |
The toughest faults to find are those that happen only once in a while: intermittents. They can be caused by bad connections, dust, dirt, corrosion or simply broken wiring or connectors. You may not be around to see it – your Fluke ScopeMeter will. In this “paperless recorder” mode, you can plot the minimum and maximum peak values and average over time – up to 22 days. The two inputs can plot any combination of voltage, current, temperature, frequency and phase – with time and date stamp -to help lead you to the cause of those faults quickly.
FlukeView® Software for documenting, archiving and analysis
FlukeView® for Windows® helps you get more out of your ScopeMeter by:
If you’re selling your Fluke 199BM please fill out form on the right hand side of page.